
An indicator alert watches RSI, a moving average or ATR for you and tells you when it reaches your value. You no longer have to check the indicator on every candle. ForecastCity makes this simple, fast and accurate. Set up the condition in a few clicks. You can also tell or ask AI Trading Assistant in your own voice or in writing to build it alongside 4CastMachine AI forecasts.
The examples use EURUSD on 1h candles: RSI 14 below 30, EMA 20 crossing above SMA 50, and an ATR 14 filter.
Example 1: get an alert when RSI falls below 30
Open EURUSD in 4CM-AI Charts. Click the lightning icon (Alerts) in the top toolbar and press +. The alert editor opens with one empty condition.
In the first box, choose RSI. A period box with 14 appears. Keep it, or type your own period.
Set the second box, the timeframe, to 1h. RSI is then measured on hourly candles, whatever your chart shows.
In the next box, choose crosses below.
In the last box, type 30.
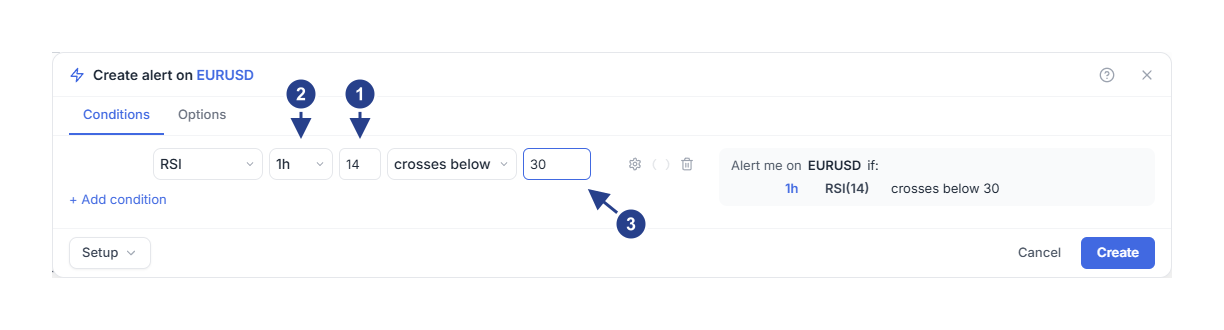
14: the RSI period, the number of candles RSI is calculated from.
1h: the timeframe. RSI is measured on candles of this size.
30: the value RSI is compared with.
The summary on the right now reads 1h RSI(14) crosses below 30. Read it before you save. For the opposite case, RSI rising above 70, choose crosses above and type 70.
Choose how often it fires
Open the Options tab. Trigger starts on Once only, unless you saved your own defaults.
Once only: the alert fires the first time RSI crosses below 30, then it stops. Choose it when one reminder is enough.
Once per bar close: the alert keeps running and fires at every new crossing. A bar is one candle. Choose it to hear about every dip below 30.
With Once per bar close, a Confirmation timeframe box appears under Trigger. Set it to 1h, the same as the condition, then press Create.
With either choice, RSI is checked only when a 1h candle closes, never in the middle of a candle.
When does it fire?
Say RSI is 34 when you save the alert at 09:30.
At 10:00 the first 1h candle closes after you saved. RSI is 31. The alert takes this as its starting point.
At 11:00 a candle closes with RSI at 28. RSI has crossed below 30, so the alert fires.
At 12:00 RSI is 26. It is still below 30, so there is no new alert.
With Once only, the alert stops after 11:00 and its status changes to Stopped: Triggered. With Once per bar close, it keeps running. RSI has to close at 30 or above, and then close below 30 again, before the next alert.
Example 2: get an alert when one moving average crosses another
Start a new alert: click the lightning icon (Alerts) in the top toolbar and press +.
In the first box, choose EMA. The period box shows 20.
Set the timeframe to 1h and choose crosses above.
Move the mouse over the row. A gear appears at the right end of the row. Click it to open Details. A second line opens under the row.
Set Compare with to Indicator. The value box leaves the first line, and two new boxes appear on the second line.
In the box that reads Indicator…, choose SMA. In the period box beside it, change 20 to 50.
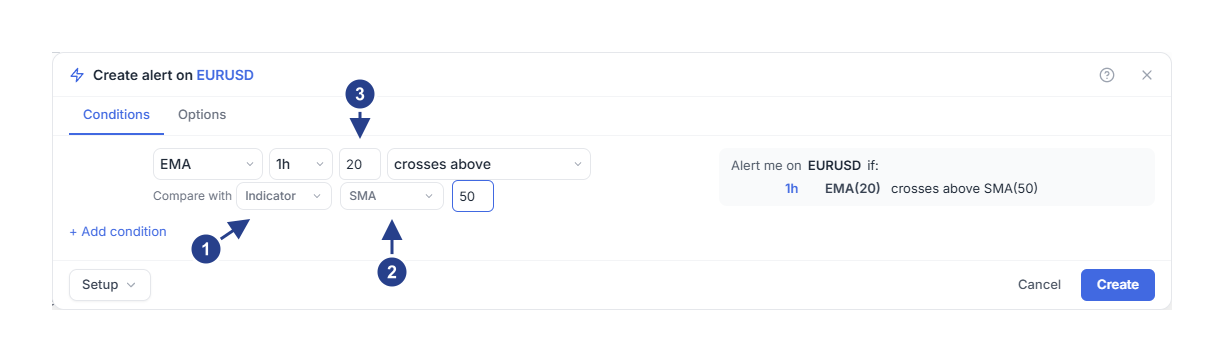
Compare with: choose Indicator to compare the EMA with a second indicator instead of a number.
SMA and 50: the second indicator and its own period.
20: the period of the first indicator, the EMA.
The summary reads 1h EMA(20) crosses above SMA(50). Both averages are measured on 1h candles. The alert fires at the 1h close where the EMA moves above the SMA.
While Compare with is set to Indicator, the second line stays open and the gear is hidden. To compare with a number again, choose Value.
To finish, set Trigger as in Example 1 and press Create. Choose Once per bar close to hear about every crossing, not only the first.
Example 3: add an ATR filter to skip a calm market
ATR shows the average range of recent candles, from high to low. As a second condition, it keeps the alert from Example 2 quiet in a calm market.
In the Alerts list, move the mouse over the alert from Example 2 and click Edit.
Press + Add condition. A new row appears under the first one, joined with and.
In the new row, choose ATR. The period box shows 14.
Set the timeframe to 1h, the same as the first condition.
Choose is above and type 0.001. On EURUSD, that is 10 pips.
Press Save.
The summary now shows a second line, and 1h ATR(14) is above 0.001. The alert fires only when both lines are true at the same 1h close.
Use is above here, not crosses above. The is above condition stays true for as long as ATR is above 0.001, which makes it a filter. A crossing happens at one moment, and both crossings would then have to happen on the same candle.
ATR is a distance in price, not a percentage. For another symbol, add the Average True Range indicator to its chart and choose a value on that scale.
Good to know
crosses below happens at one moment, when RSI moves below 30. The is below choice stays true for as long as RSI stays under 30. Use it as a filter beside another condition.
The alert starts from the market as it is when you save it. The first candle close after that only sets the starting point. If RSI is already below 30, the alert waits until RSI closes at 30 or above and falls below again.
Periods for RSI, EMA, SMA and ATR go from 1 to 200. Compare with offers the same four indicators.
A Price condition compares price with numbers you type, not with an indicator. To compare price with an average, choose SMA with period 1 in the first box. Its value is each candle's close. Then compare it with the average through Compare with.
An alert with two conditions needs a subscription plan that includes multi-condition alerts. Otherwise pressing + Add condition or Save opens an upgrade card.
If it does not fire
Wait for the candle to close. The chart shows RSI moving during the candle. The alert reads RSI only at the close. A dip below 30 that closes above 30 does not count.
Open the alert with Edit. Compare the indicator, its period, the timeframe and the value with the indicator on your chart.
The alert needs enough candle history on its timeframe to calculate the indicator. Until then it stays quiet.
Check that the alert reads Active in the Alerts list. Outside the hours set in Schedule, the alert does not fire, and nothing is saved for later.