
You marked an area with a rectangle, or drew Fibonacci levels on a swing. An alert on the drawing tells you when price gets there, so you no longer have to watch the chart. ForecastCity makes setting it up simple, fast and accurate. Start it from the drawing in seconds. You can also tell or ask AI Trading Assistant in your own voice or in writing to build it alongside 4CastMachine AI forecasts.
The examples: a rectangle on EURUSD from 1.0850 to 1.0900, and the 61.8% level of a Fibonacci retracement.
Start an alert from the drawing
Click the rectangle or the Fibonacci drawing to select it. A small toolbar appears.
Press the lightning button in the toolbar (Add alert on this drawing). You can also right-click the selected rectangle and choose Add alert on Rectangle.
The alert editor opens with a Line condition for the drawing. Check the symbol in the window title and the drawing's name in the condition.
If the drawing already has an alert, the same button opens that alert for editing instead. When you move the mouse over the button for an active or paused alert, it reads Edit alert on this drawing.
Always start from the drawing itself. Pick on chart in a Line condition offers only straight lines.
Example 1: price enters your rectangle
Select the rectangle and drag one of its right corners far enough to the right to cover the time you want to watch.
Start the alert from the drawing, as above. The condition starts on enters.
Press Create.
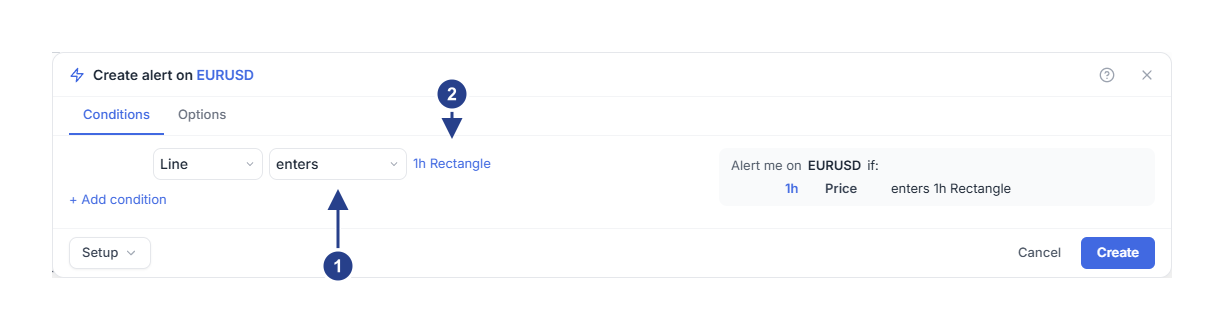
enters: price moves into the rectangle. The other two choices are exits and is inside.
1h Rectangle: the rectangle the alert watches, by its name.
When does the rectangle alert fire?
Price is inside the rectangle only when both parts match. The time must sit between its left and right edges, and the price must sit between its top and bottom. Say the rectangle reaches to the end of today, and EURUSD trades at 1.0930:
At 10:12 price falls to 1.0898, inside the rectangle. With Once only, the alert fires at that moment.
With Once per bar close, the alert waits for the candle to close. If that candle closes at 1.0905, back above the rectangle, the dip does not count.
A rectangle condition has no timeframe box. It takes the chart's timeframe when you add the rectangle to the alert, shown at the start of the summary line: 1h in 1h Price enters 1h Rectangle. The second 1h is only part of the rectangle's name. With Once per bar close, the candles of that timeframe decide, so keep Confirmation timeframe on the same timeframe. For other candles, switch the chart to that timeframe first, then add the rectangle.
When time passes the right edge, the rectangle has ended. The alert no longer sees price inside it, even if price is still between its two prices. An exits alert fires then, if price was inside. Drag the right edge further to keep watching. The alert's Expiration does not stretch the rectangle.
Choose enters, exits or is inside
enters happens at one moment, when price moves into the rectangle.
exits happens at one moment, when price leaves it.
is inside is a condition that stays true for as long as price is in the rectangle. It works best next to another condition, as a filter.
A rectangle has no Buffer and no confirmation. The rectangle itself is the zone. Those settings do not appear.
A rectangle alert watches the rectangle you drew. It never follows a 4CM-AI Buy zone or Sell zone. For those, see Get an alert when price reaches a forecast zone.
Example 2: watch the 61.8% level
Draw a Fib Retracement from the swing low to the swing high, or select one you drew.
Start the alert from the drawing with the lightning button. The condition starts on touches.
Move the mouse over the condition and click the gear (Details). The Level box starts on 61.8%. Choose another level there if you need one.
Keep Buffer at 0.25 with ATR ×, or switch the unit to Absolute for a fixed price distance.
Press Create.
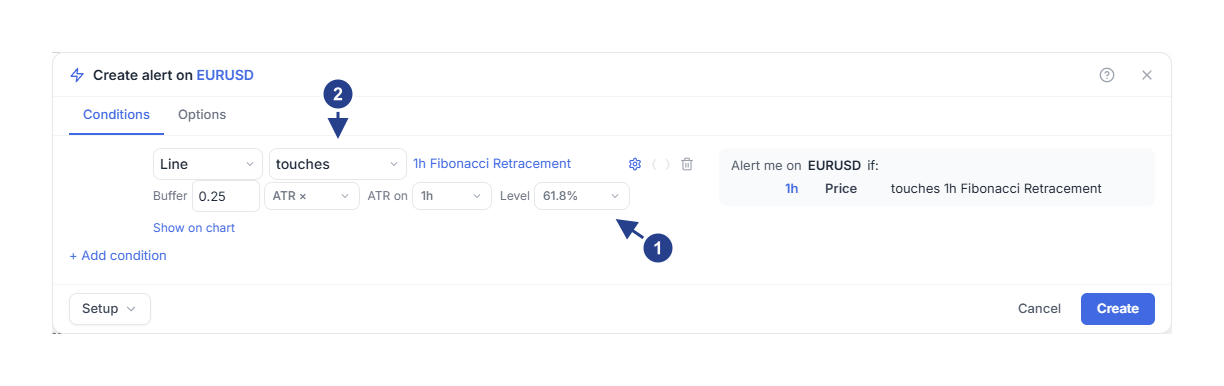
Level: the one Fibonacci level the alert watches, here 61.8%.
touches: what has to happen at that level. The same four choices as for a line apply.
The Level list offers 0.0%, 23.6%, 38.2%, 50.0%, 61.8%, 78.6%, 100.0%, 127.2%, 141.4%, 161.8% and 261.8%. One alert watches one level. You can choose touches, approaches, breaks or bounces off, with the same buffer and confirmation as a line. Create alerts on chart lines explains each one.
How the level is measured
The alert measures from the points as you drew them: 100% at the first point, 0% at the second. If you tick Reverse in the drawing's settings, the chart shows the levels flipped, but the alert keeps measuring the original way.
The alert treats the level as a price. It keeps watching that price after the drawing ends on the chart.
Before you save, press Show on chart in Details. The chart highlights the exact line the alert will watch. Always check it for a Trend-Based Fib Extension: its alert level can differ from the level the chart draws.
When you move or delete the drawing
Moving or resizing the drawing updates its alerts. Deleting it pauses its active alerts, and a message says "Alert paused (linked drawing was deleted)".
The drawing's lightning button opens only one of its alerts. To watch a second level of the same drawing, click the lightning icon (Alerts) in the top toolbar. Move the mouse over the alert and choose Duplicate, then edit the copy and change its level.
If the alert does not fire
Check that the rectangle still covers the current time. Its right edge may already be in the past.
With Once per bar close, only closes count. A wick into the rectangle or through the level does not.
Press Show on chart and compare the highlighted line with the level you meant.
Check that the alert is Active. A deleted drawing leaves its alert on Stopped: Paused.