
MACD, Bollinger Bands and Stochastic each draw more than one line. An alert watches the exact line you choose and checks it at every candle close. ForecastCity makes this simple, fast and accurate. Pick the line and value in seconds. You can also tell or ask AI Trading Assistant in your own voice or in writing to set it up alongside 4CastMachine AI forecasts.
The examples use EURUSD. We watch the MACD histogram cross above 0 (1h), the upper Bollinger Band cross above 1.1 (1h), and Stochastic %K cross below 80 (15m).
Open the indicator settings
For these three indicators, the settings and the line the alert reads are in Details.
Move the mouse over the condition row. A gear appears at the right end of the row. It shows only while the mouse is over the row.
Click the gear, named Details. A second line opens under the row, with Compare with, the settings and, at the end, the plot box. A plot is one of the indicator's lines.
Click the gear again to close the second line. Your settings stay as they are.
Example 1: the MACD histogram crosses above 0
Open EURUSD in 4CM-AI Charts. Click the lightning icon (Alerts) in the top toolbar and press +.
In the first box, choose MACD. Set the timeframe to 1h.
Choose crosses above and type 0 in the value box.
Open Details with the gear. The three setting boxes show 12, 26 and 9. Keep them, unless your chart's MACD uses other settings.
In the plot box at the end of the second line, choose hist. It starts on line.
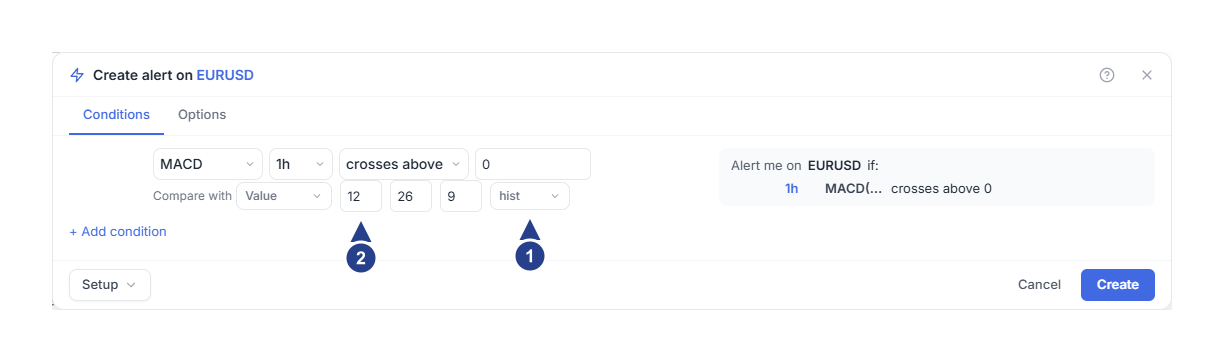
hist: the plot. The condition reads the MACD histogram.
12, 26 and 9: the MACD settings. They are the fast period, the slow period and the period of the MACD line's own average.
The histogram is the gap between the MACD line and its 9-period average. It crosses above 0 when the MACD line rises above that average. To watch the MACD line itself cross 0, choose line instead.
Now choose how often the alert fires, and save it.
Open the Options tab. Trigger starts on Once only, unless you saved your own defaults. With it, the alert fires once and then stops.
To hear about every crossing, set Trigger to Once per bar close. A bar is one candle. Set the Confirmation timeframe box to 1h, the same as the condition.
Press Create.
Example 2: the upper Bollinger Band crosses a price
Start a new alert and choose Bollinger in the first box. Set the timeframe to 1h.
Choose crosses above and type a price, for example 1.1.
Open Details with the gear and check the two settings. The period is 20, and 2 is the width of the bands in standard deviations.
In the plot box, choose upper. It starts on basis.
On the Options tab, set Trigger as in Example 1, then press Create.
The Bollinger alert watches the upper band itself. It fires at the 1h close where the band's value rises above 1.1. It does not tell you that price crossed the band. The other plots are basis, the middle line (the 20-period average of the close), and lower, the lower band.
To watch price inside a fixed range instead, use a Price condition, as shown in Alerts for price moves and price ranges.
Example 3: Stochastic %K crosses below 80
Start a new alert and choose Stoch in the first box. Set the timeframe to 15m.
Choose crosses below and type 80.
Open Details with the gear. Check the three settings: 14, 3 and 3. In this order, they are the %K period, the %D period and the smoothing.
Check the plot box. It shows k, which is the %K line. Choose d instead to watch the %D line, the average of %K.
On the Options tab, set Trigger as in Example 1. With Once per bar close, set Confirmation timeframe to 15m.
Press Create.
The alert fires at the 15m close where %K moves from 80 or above to below 80.
When does it fire?
Each alert is checked when a candle of its own timeframe closes. Take the MACD alert, and say the histogram is below 0 when you save it.
At 13:00 a 1h candle closes. The histogram is still below 0, so nothing happens.
At 14:00 a candle closes with the histogram above 0. The alert fires.
At 15:00 the histogram is still above 0. There is no new alert.
During the hour, the chart updates MACD with every price change. The histogram can pass 0 and come back before the candle closes. The alert reads the value only at the close. With Once per bar close, the next alert comes after the histogram closes at 0 or below, and then above 0 again.
Good to know
The chart's Stochastic settings list %K Length, %K Smoothing and %D Smoothing. The alert editor uses another order. Your chart's %K Smoothing goes into the third box, and its %D Smoothing into the second. Move the mouse over a box to see its name.
Compare with offers a number (Value) or a second indicator: RSI, EMA, SMA or ATR. It cannot compare two lines of the same indicator. For the MACD line against its average, use hist and 0, as in Example 1.
Periods take whole numbers from 1 to 200. The MACD fast period must be smaller than the slow period. The Bollinger period starts at 2, and the band width can be at most 10. Otherwise Create stays grey. Move the mouse over it to see why.
In the summary on the right, a long indicator name is cut short. Move the mouse over it to read it in full, for example MACD(12, 26, 9) hist. Bollinger appears there as BB.
Use is above or is below when the line is a filter for another condition. They stay true for as long as the line stays on that side.
If it does not fire
Wait for the candle to close. The alert reads the indicator only when a candle of the condition's timeframe closes.
Open the alert with Edit. Compare the settings, the plot and the timeframe with the indicator on your chart.
The alert needs enough candle history on its timeframe to calculate the indicator. The first candle close after you save only sets the starting point.
Check that the alert reads Active in the Alerts list. Outside the hours set in Schedule, the alert does not fire, and nothing is saved for later.